More Powerful. More Intuitive. More Helpful.
More Ways To Improve Your Process.
The latest version of our award-winning software is now available.
A host of new features, accessible through an interface that will quickly help users get the most from their data.
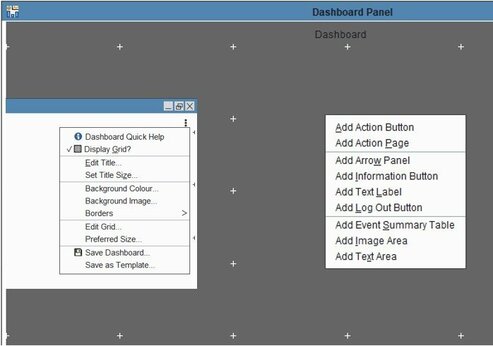
Dynamic, SecureDashboard |
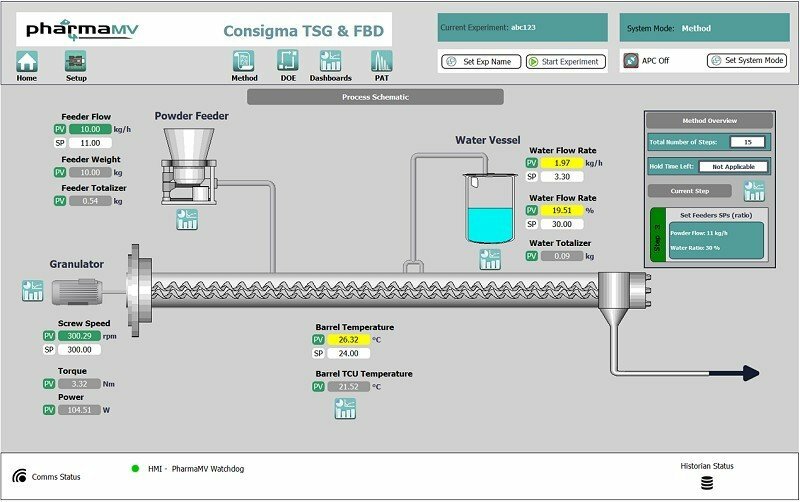
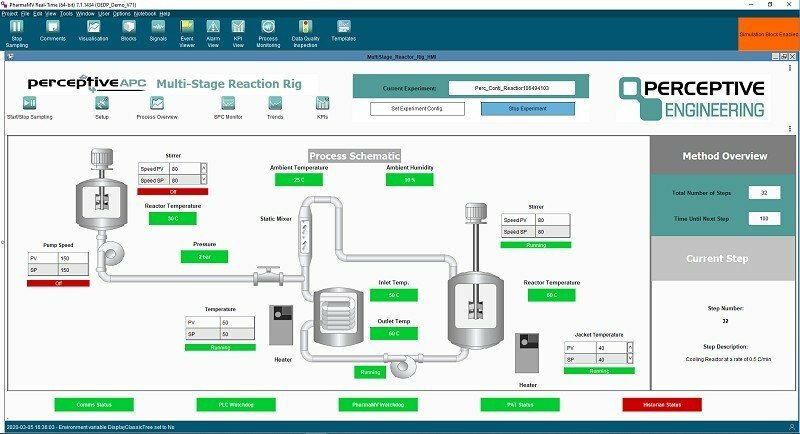
Design and deploy a Graphical User Interface for your process or pilot plant.
Do all of this within the same software platform that captures and aligns data, then monitors and optimises your process.
|
|
Context Help
|
Expert help, always just one click away.
Context-driven Information Pages - docked or free-floating - provide guidance and assistance when and where you need it most. 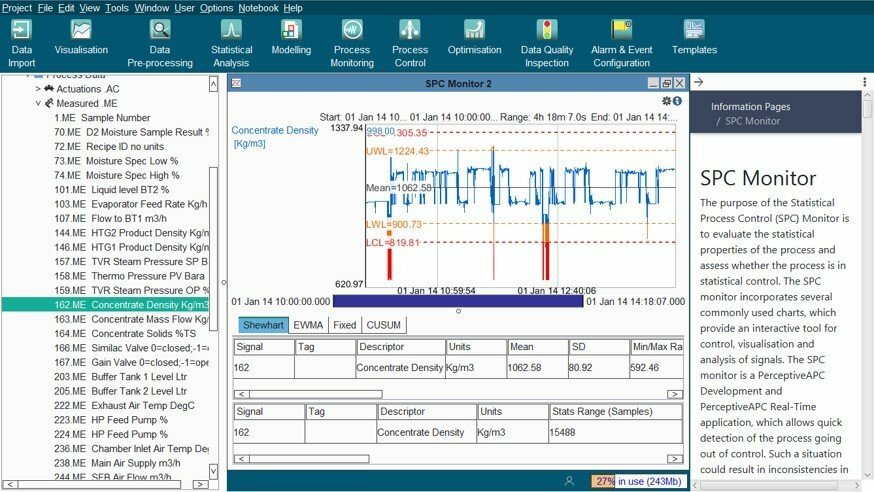 |
|
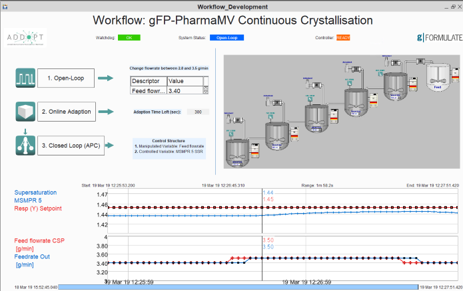
Controller Comparison
|
Develop and fine-tune process controllers.
Compare setpoint response, disturbance response and robustness, in side-by-side windows. Once it's built, deploy it seamlessly in real time. 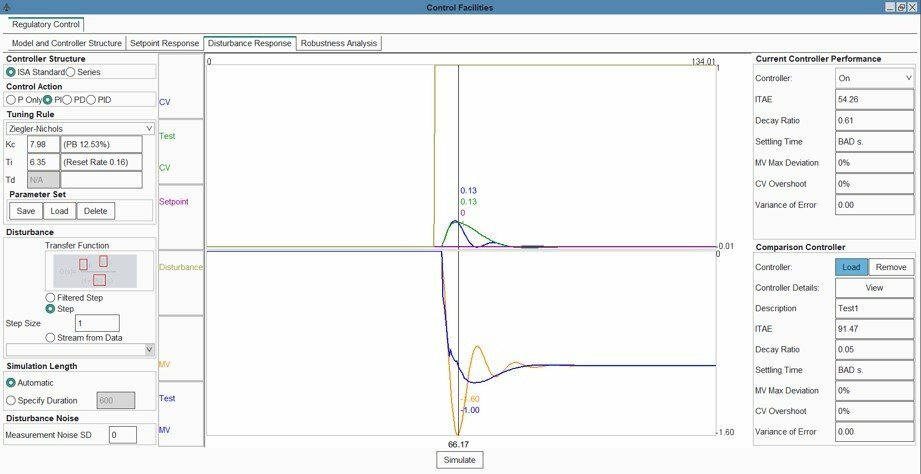 |
|
Gauge R&R |
How trustworthy is the data from your instrumentation?
How much variability exists and how does this impact your improvement initiatives? What is this doing to efficiency, throughput and product quality? 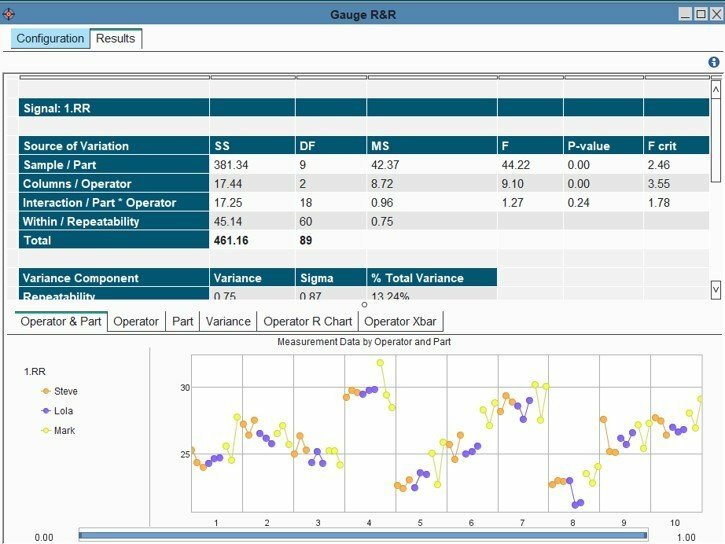 |
|
DoE Manager |
PerceptiveAPC now includes a dedicated block for real-time Design of Experiments execution. The time to steady state, time at steady state and rate-of-change tolerance at steady state are defined. This then determines the minimum experiment time required. Users can quickly create intuitive templates for data entry, or sophisticated reports for dissemination. Users can create or import an experimental design and configure it to run automatically on the process of interest. PerceptiveAPC will collate dynamic and steady state data, then provide results in a number of pre-defined formats. 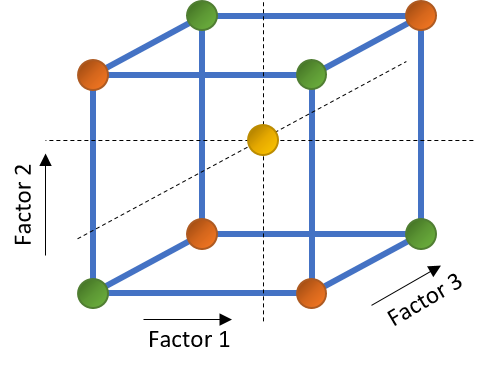
|
|
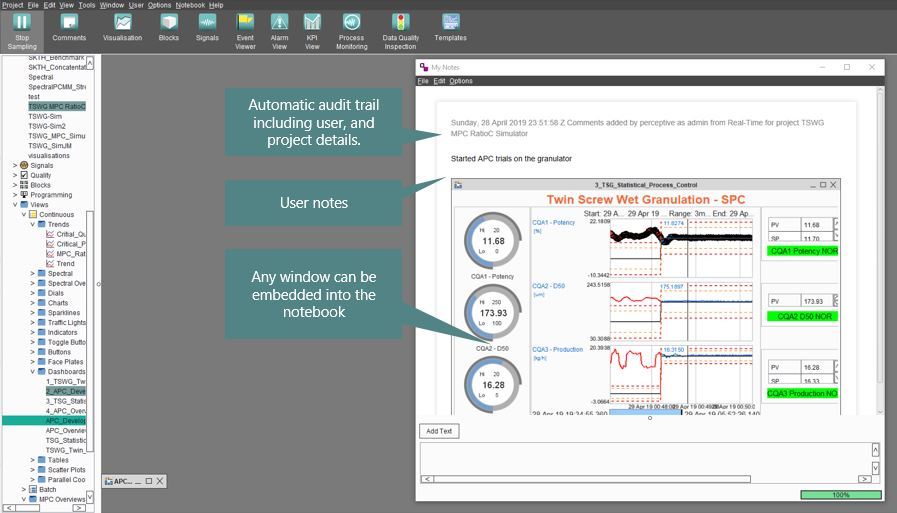
Notebook |
Keep all your notes, comments and observations together, embedded within your project, with a full audit trail. Add any project window to those notes, from configuration pages to scatter plots.
|
|
Reporting |
Improvements to the drag-and-drop dashboard now allow spectral waterfall plots to be displayed and shared. Raw and processed spectral data can be quickly visualised - a new engine draws more than 6 million data points per second. 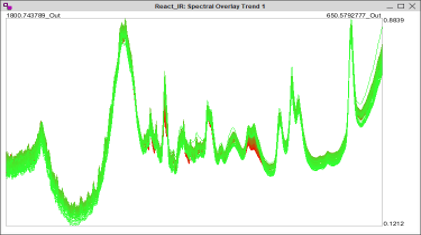
|
|
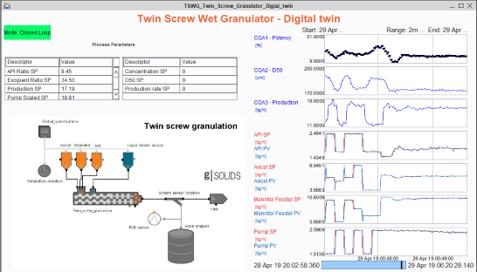
gProms Interface |
|
Coming from the collaborative ADDoPT project, Perceptive's PharmaMV provides an interface to PSE's "g" products. Mechanistic process simulations can be connected to PharmaMV as a “Digital Twin” of the process, enabling more rapid development and validation of monitoring and control strategies.
|
|
OPC-UA
|
The latest standard in open connectivity is now baked into the PerceptiveAPC software suite, to make data easier to share, interpret and act on.

|